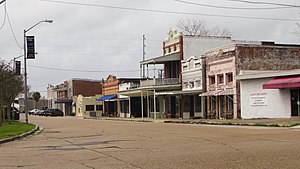
Morgan City
Morgan City nyɛla gbaŋpiɛla tiŋgbaŋ karili (city) be United States,di nyɛla Louisiana tiŋgbani yaɣ'shɛli.
Morgan City
| Di pilli ni | 1860 |
|---|---|
| Tiŋa | America |
| Din be shɛli polona | St. Martin Parish |
| Yaɣili pɛhigi | Morgan City urban area |
| Tiŋgbaŋ yaɣili calinli | 29°42′3″N 91°11′50″W |
| Tiŋgbani nahangbani kalinli | 70380, 70381 |
| Lahabaya dundɔŋ din mali dihitabili | http://www.cityofmc.com/ |
| Tiŋbani puuni koll koodi | 985 |

Taarihi
mali niŋGeography/Joografi/tiŋgbani baŋsim bɔhimbu
mali niŋClimate
mali niŋ| Climate data for Morgan City, Louisiana (1991–2020 normals, extremes 1922–present) | |||||||||||||
|---|---|---|---|---|---|---|---|---|---|---|---|---|---|
| Month | Jan | Feb | Mar | Apr | May | Jun | Jul | Aug | Sep | Oct | Nov | Dec | Year |
| Record high °F (°C) | 84 (29) |
86 (30) |
90 (32) |
92 (33) |
96 (36) |
101 (38) |
102 (39) |
101 (38) |
99 (37) |
97 (36) |
91 (33) |
86 (30) |
102 (39) |
| Average high °F (°C) | 63.0 (17.2) |
66.5 (19.2) |
71.8 (22.1) |
78.0 (25.6) |
84.1 (28.9) |
88.9 (31.6) |
90.5 (32.5) |
90.4 (32.4) |
87.9 (31.1) |
81.1 (27.3) |
72.0 (22.2) |
65.6 (18.7) |
78.3 (25.7) |
| Daily mean °F (°C) | 54.2 (12.3) |
57.7 (14.3) |
63.2 (17.3) |
69.5 (20.8) |
76.4 (24.7) |
81.7 (27.6) |
83.4 (28.6) |
83.3 (28.5) |
80.5 (26.9) |
72.4 (22.4) |
62.5 (16.9) |
56.6 (13.7) |
70.1 (21.2) |
| Average low °F (°C) | 45.4 (7.4) |
48.9 (9.4) |
54.6 (12.6) |
61.0 (16.1) |
68.7 (20.4) |
74.6 (23.7) |
76.3 (24.6) |
76.2 (24.6) |
73.0 (22.8) |
63.7 (17.6) |
53.0 (11.7) |
47.7 (8.7) |
61.9 (16.6) |
| Record low °F (°C) | 12 (−11) |
17 (−8) |
17 (−8) |
35 (2) |
42 (6) |
55 (13) |
60 (16) |
56 (13) |
46 (8) |
35 (2) |
22 (−6) |
10 (−12) |
10 (−12) |
| Average precipitation inches (mm) | 4.99 (127) |
3.27 (83) |
3.86 (98) |
4.02 (102) |
4.55 (116) |
7.02 (178) |
6.23 (158) |
7.27 (185) |
5.40 (137) |
4.03 (102) |
3.91 (99) |
3.96 (101) |
58.51 (1,486) |
| Average precipitation days (≥ 0.01 in) | 10.0 | 8.2 | 7.4 | 7.0 | 7.1 | 11.5 | 14.2 | 14.8 | 10.8 | 6.8 | 7.0 | 8.2 | 113.0 |
| Source: NOAA[1][2] | |||||||||||||
Demographics
mali niŋ| Census | Pop. | Note | %± |
|---|---|---|---|
| 1880 | 2,015 | — | |
| 1890 | 2,291 | Tɛmplet:Round% | |
| 1900 | 2,332 | Tɛmplet:Round% | |
| 1910 | 5,477 | Tɛmplet:Round% | |
| 1920 | 5,429 | Tɛmplet:Round% | |
| 1930 | 5,985 | Tɛmplet:Round% | |
| 1940 | 6,969 | Tɛmplet:Round% | |
| 1950 | 9,759 | Tɛmplet:Round% | |
| 1960 | 13,540 | Tɛmplet:Round% | |
| 1970 | 16,586 | Tɛmplet:Round% | |
| 1980 | 16,114 | Tɛmplet:Round% | |
| 1990 | 14,531 | Tɛmplet:Round% | |
| 2000 | 12,703 | Tɛmplet:Round% | |
| 2010 | 12,404 | Tɛmplet:Round% | |
| 2020 | 11,472 | Tɛmplet:Round% | |
| U.S. Decennial Census[3] | |||
| Race | Number | Percentage |
|---|---|---|
| White (non-Hispanic) | 6,640 | 57.88% |
| Black or African American (non-Hispanic) | 2,510 | 21.88% |
| Native American | 104 | 0.91% |
| Asian | 187 | 1.63% |
| Pacific Islander | 1 | 0.01% |
| Other/Mixed | 480 | 4.18% |
| Hispanic or Latino | 1,550 | 13.51% |
Demographics/ninsali biɛlim kalibu baŋsim bɔhimbu
mali niŋBomma ni nyamma soya/Economy
mali niŋZalikpana mini Gɔmnanti tali/Law and Government
mali niŋBaŋsim Bɔbu/Education
mali niŋKaya ni taada
mali niŋLahabali churi/Media
mali niŋBinkpɛra/Transportation
mali niŋKundivihira
mali niŋ- ↑ NowData - NOAA Online Weather Data. National Oceanic and Atmospheric Administration.
- ↑ Station: Morgan City, LA. U.S. Climate Normals 2020: U.S. Monthly Climate Normals (1991-2020). National Oceanic and Atmospheric Administration.
- ↑ United States Census Bureau. Census of Population and Housing.
- ↑ Explore Census Data.
